-
About Us
-
About Us
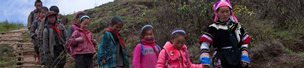
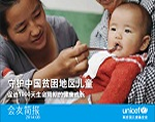
UNICEF and China have a long history of collaboration. We currently collaborate on programming in many areas, include: supporting children affected by HIV and AIDS , preventing child trafficking, expansion of early childhood development services and improving school quality.

-
-
Our Priorities
-
Our Partners
-
Programmes

UNICEF's work for children is organized in five year programmes of cooperation which are planned and implemented in cooperation with the Government of China.
-
Corporate
Our private sector collaborations provide critical resources to support UNICEF programs that address children’s needs, and at the same time provide a platform for businesses to promote a specific child-rights focus in their socially-responsible engagement with the community.
-
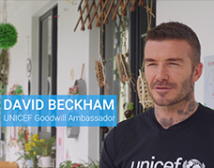
Celebrities
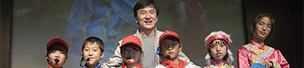
All celebrities who put their talents to work for UNICEF share a dedicated commitment to improving the lives of children. In China, our celebrity Goodwill Ambassadors and Special Advocate are passionate about improving the lives of children in China.
-
Champions for Children
Support from philanthropic people can make an impact on the lives of children in China. By exerting their influences and convening resources, the Champions for Children are playing a unique role in supporting UNICEF's programme for children in China.
-
-
Support Us
-
Give Monthly
Regular support makes the most difference for children.
-
Donate Now

You could choose desired project and make one-off donation. You contribution is great support to the children!
-
Take Action

Simple, everyday actions, starting with your own family or community, can lead to the most important changes for children.
-
Newsletters
Download pervious newsletters and learn about UNICEF’s work.
-
Sign up
 You will receive information and updates about children’s rights and UNICEF’s work.
-
-
Events
-
CRC 25 Anniversary
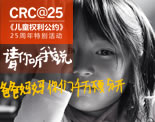
The Convention on the Rights of the Child.
-
End Violence Against Children

Protect children from violence, exploitation and abuse.
-
Early Childhood Development

-
10m2 of Love

Locate, register, certify and publicize breastfeeding rooms.
-